Draw/plot a Line in Emerson Quick Panel HMI

Tadwaco

Member
Join Date
Nov 2023
Location
Uganda
Posts
9
Hello,

I want to plot a line on X,Y axis with defined start and end points on Quick Panel+. I use PAC Machine Edition 9.7, and it supports ViewScript and VBScript. in ViewScript, there is DrawLine function (DrawLine(intHor1Pos, intVer1Pos, intHor2Pos, intVer2Pos, intColor, intStyle))e.g DrawLine(0,0,30,30,1,1). If i input this line in the script editor, i get error of invalid function, yet in the example in the software it is working well. I tried to use the VBScript option but i have no idea how it is done. Anyone who has ever done it or has any idea?

I tried contacting Emerson support but i was told to open a support contract with them, so they could not help me.
 
The DrawLine function is a QPscript function, not a ViewScript function. I believe QPScript is a holdover from the original Quick Panel line from Total Control Products. Are you sure it is supported on your target?
Instead of drawing a line, you could try applying visibility animation to a line object. Also look into the size and position animation tabs for a line object.

Thanks Steve.

True the DrawLine function is a QPScript. The target am using is QuickPanel+ 15" TFT Capacitive(IC755CxS15Cxx). I checked and it does not support QPScript, but it supports ViewScript and VBScript. Is there any way to achieve the same goal to plot X, Y line coordinates in ViewScript or VBScript?

I will try the vissibility animations, but what am looking at is the real-time plot for a line, with X, Y coordinates.

Regards.
 
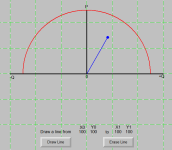
Here is a Proficy version 7 project that uses visibility, size, and position animation to draw lines. When entering start and end positions, make sure the X0 point is less than the X1 point. The Y0 point can be smaller or larger than the Y1 point.

There are actually three lines on the screen, the red one visible when the slope of the line is positive, the yellow one visible when the slope is negative, and the black one visible when the line is horizontal. I needed different colors for the three lines for debugging, and left the colors in place. The yellow and black lines are hard to find in the design time screen. They are both anchored at the lower left corner of the screen.
 
Hello Steve,

Thanks a lot, it is helpful. I have encountered the challenge of plotting the negative values on the X-axis, how can this be achieved? My goal is to plot a generator capability curve with reactive power on the X-axis and active power on the Y-axis, as shown in the attached Image, i also attached the project file.

Thanks

Cap_Curve.PNG
 

Attachments

  • Cap_curveHMI.zip
    26.6 KB · Views: 0
Hello Steve, sure I did and it is working well so far.

Am trying to align it to a specific position on the screen (since the object arrangement on the screen is: trend on the left and the PQ curve on the right), I can see in the script the position to draw the lines is defined (as 400), if I remove the 400 and define a specific start position on the screen, the yellow line does not work as expected, but the red line is fine. I have spent a day trying to figure out this, but still yielding no results.
 
My example is based on an area 800 pixels wide by 600 pixels tall. If you want to confine your line to a smaller area, reposition the lines to the edges of that area and adjust your minimum and maximum extents for the horizontal and vertical size animation accordingly.
You could also look into rotation animation for this application.
 
Hello Steve,

Thanks a lot for your support. I managed to have done. Maybe one more question, if I want to put an arrow or a dot at the end of the line, is there a way I can use the x and y coordinates to display it?
 
Putting a dot at the end of the line would be easiest. Starting with the version I posted in post #6, I located the center of a circle at the lower left and used the "Active" and "Reactive" variables for vertical and horizontal position animation. That worked fine.
To do an arrowhead you could add two more lines and give them rotation animation along with position animation, calculating the angle from the X and Y positions. Doable with a fair amount of trial and error.
 
I located the center of a circle at the lower left and used the "Active" and "Reactive" variables for vertical and horizontal position animation. That worked fine.
To do an arrowhead you could add two more lines and give them rotation animation along with position animation, calculating the angle from the X and Y positions. Doable with a fair amount of trial and error.
Steve,
I did not get the part about "locating the center of the circle at the lower left". For example, when I place the dot at position left: 400, the positive reactive and active position the dot at the right point, but for the negative reactive, the dot is positioned at the right position for the active, but can not cross to the negative side, it is position like reactive is 0
 

Similar Topics

Hello, I want to plot a line on X,Y axis with defined start and end points on Quick Panel+. I use PAC Machine Edition 9.7, and it supports...
Replies
0
Views
346
I want to draw a shape on a screen page in TIA/WinCC. It's roughly the shape of a canal boat hull -see picture. I couldn't find any "free-form"...
Replies
9
Views
1,552
I was wondering if anyone had any insight on to how i could monitor and possibly graph Amp draw on our Powerflex 525 Drives. These drives are...
Replies
5
Views
1,755
Hello, anyone knows where to find Rockwell/Allen Bradley shapes or stencils for visio (microsoft) or draw (libreoffice)? I am interested in...
Replies
6
Views
7,459
Have a good day all of you. Im a beginner on PLC so I can't run use I/O this question. Can anybody help me ?
Replies
1
Views
1,602
Back
Top Bottom